Command your facility’s reporting experience with ZerosCharts™. Our beautifully designed and intuitive interface empowers teams to take control of their reports, uncover trends, and make informed decisions with ease.
ZerosCharts™
Simple yet flexible interactive charts for operational teams utilizing fulfillment and distribution digital technologies. ZerosCharts™ provides a clear visual distinction between multiple datasets and your facility's day-to-day activities.
Request a Demo
ZerosCharts™
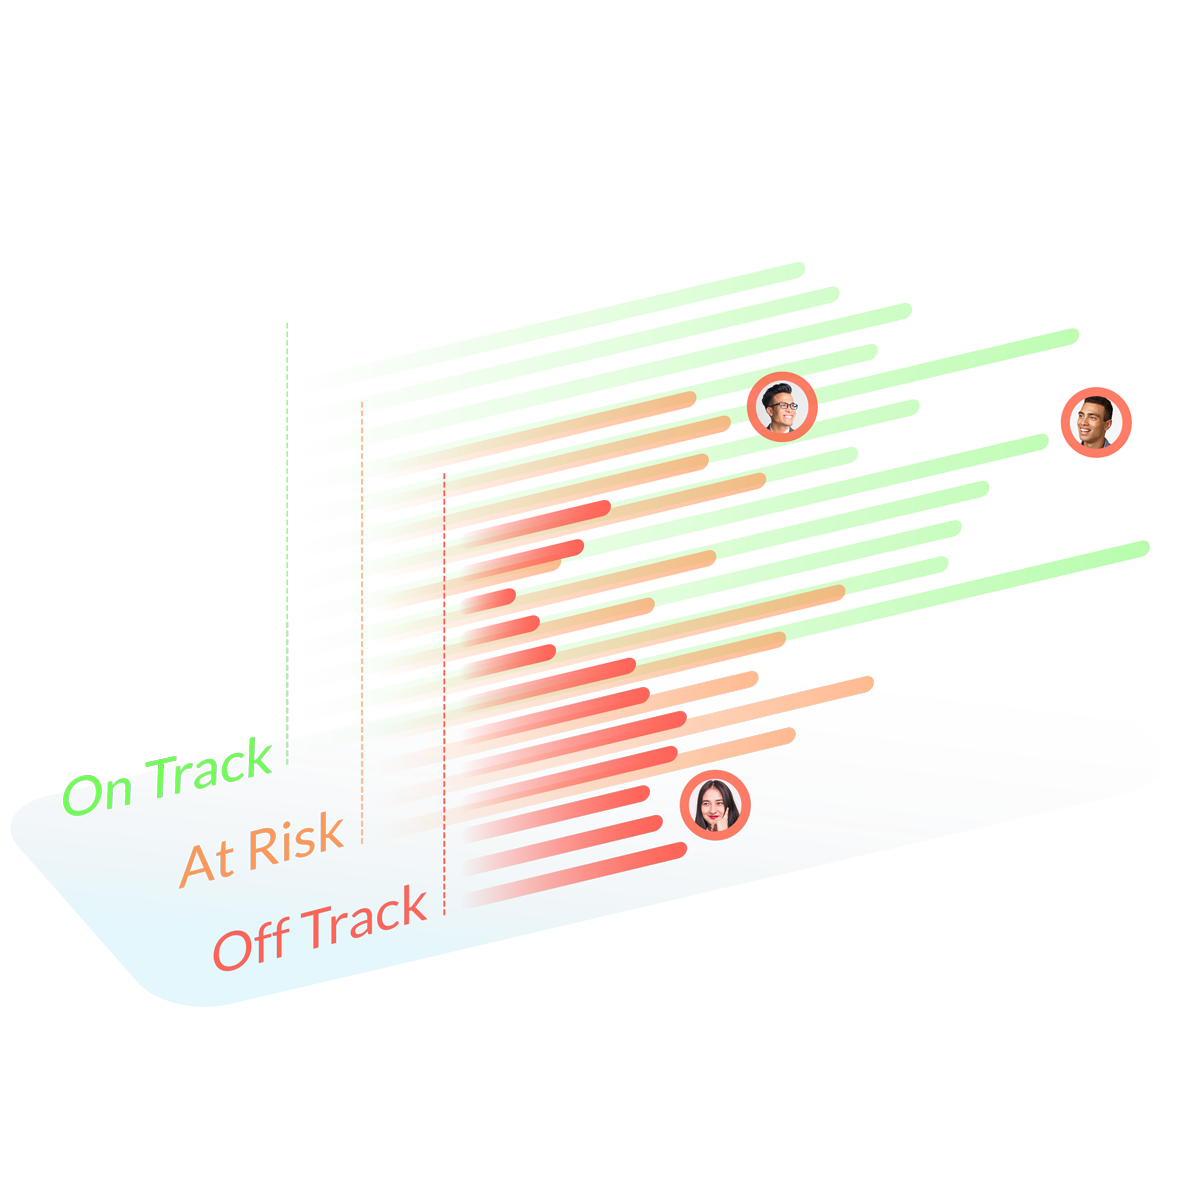
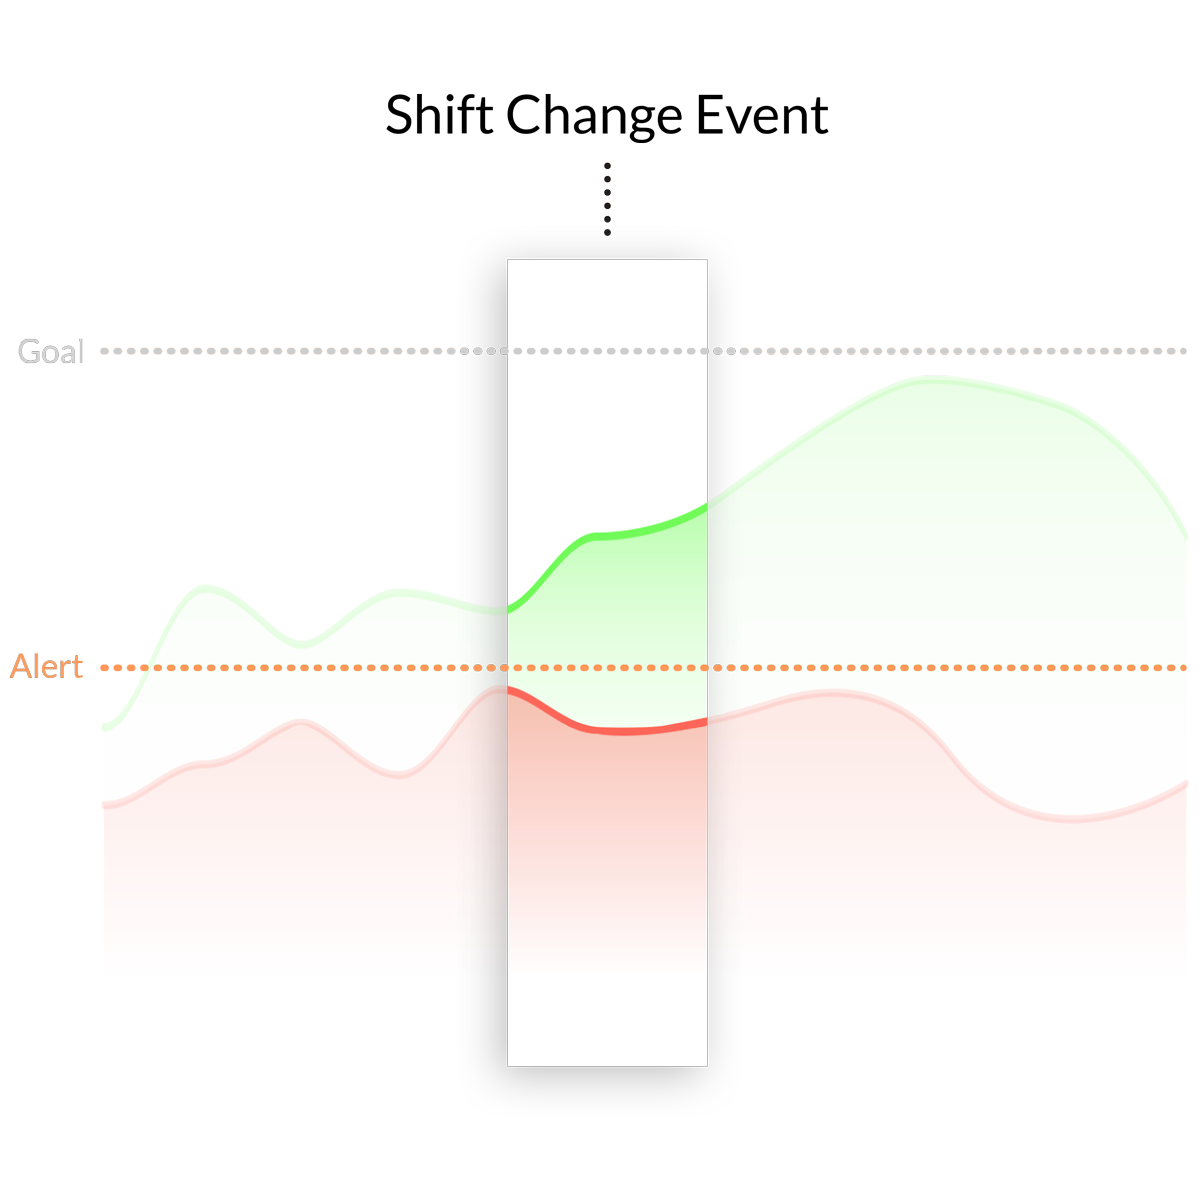
Visualize What Happened and When
Add Events
Create Triggers
Create Alerts
Set Goals
ZerosCharts™
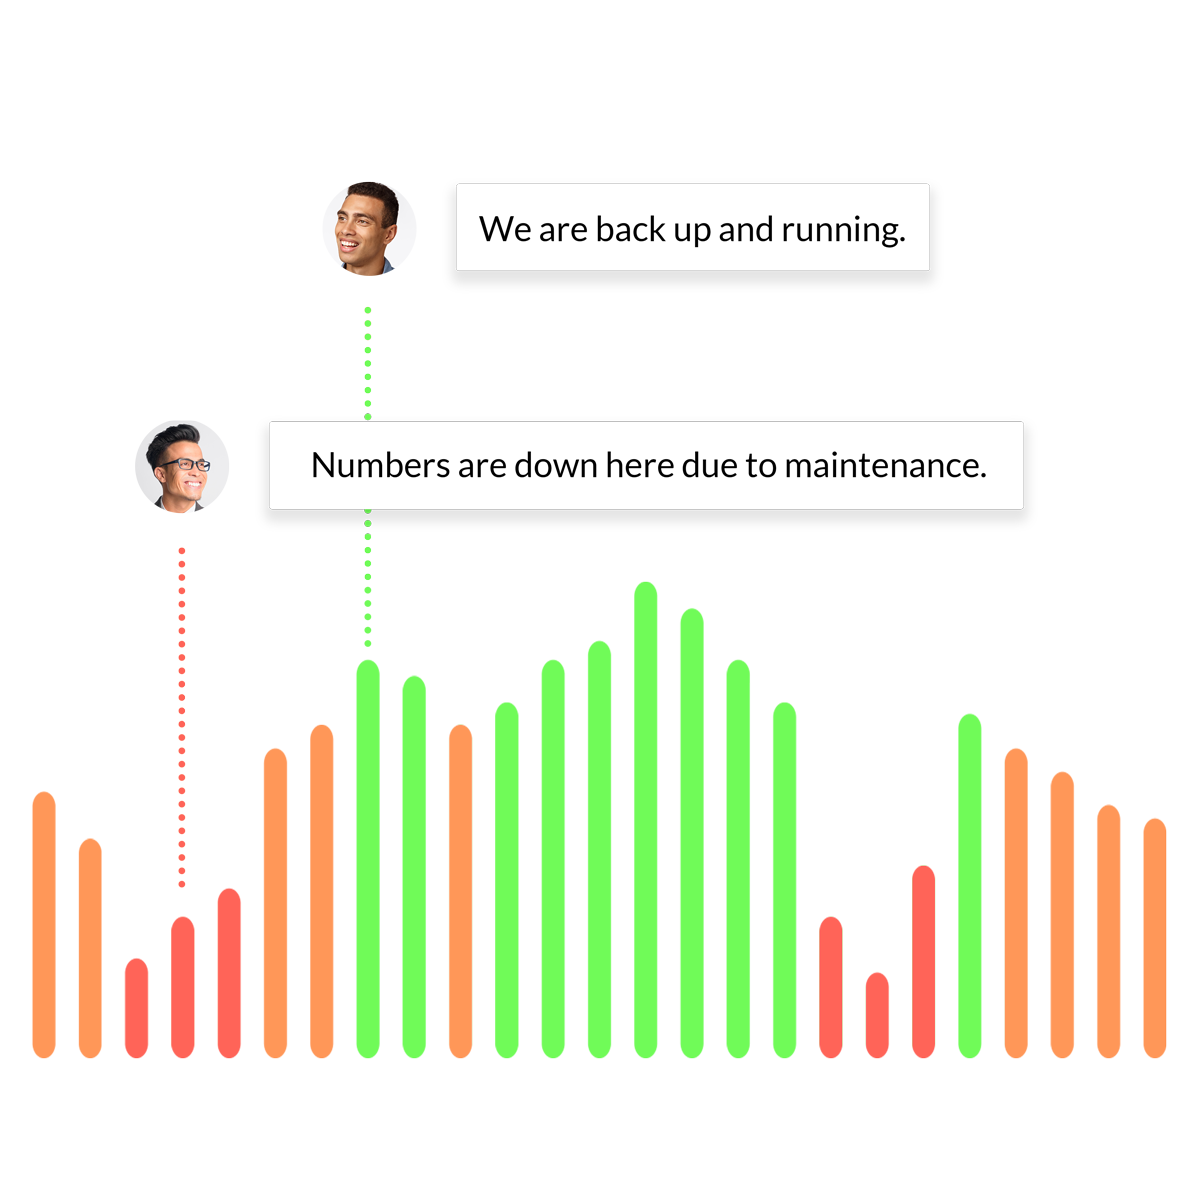
Keep Team Members In the Loop
ZerosCharts™ makes it easy to see which areas of your operation are under or over-performing. Operational teams need the ability to collaborate on reports and bring together stakeholders in real-time, not spend days and weeks coordinating calendars and scheduling meetings. With our easy collaboration, you will experience improved response times to critical issues. With Charts, users can:
Leave a Comment
Set a Status
Tag a Teammate
ZerosCharts™
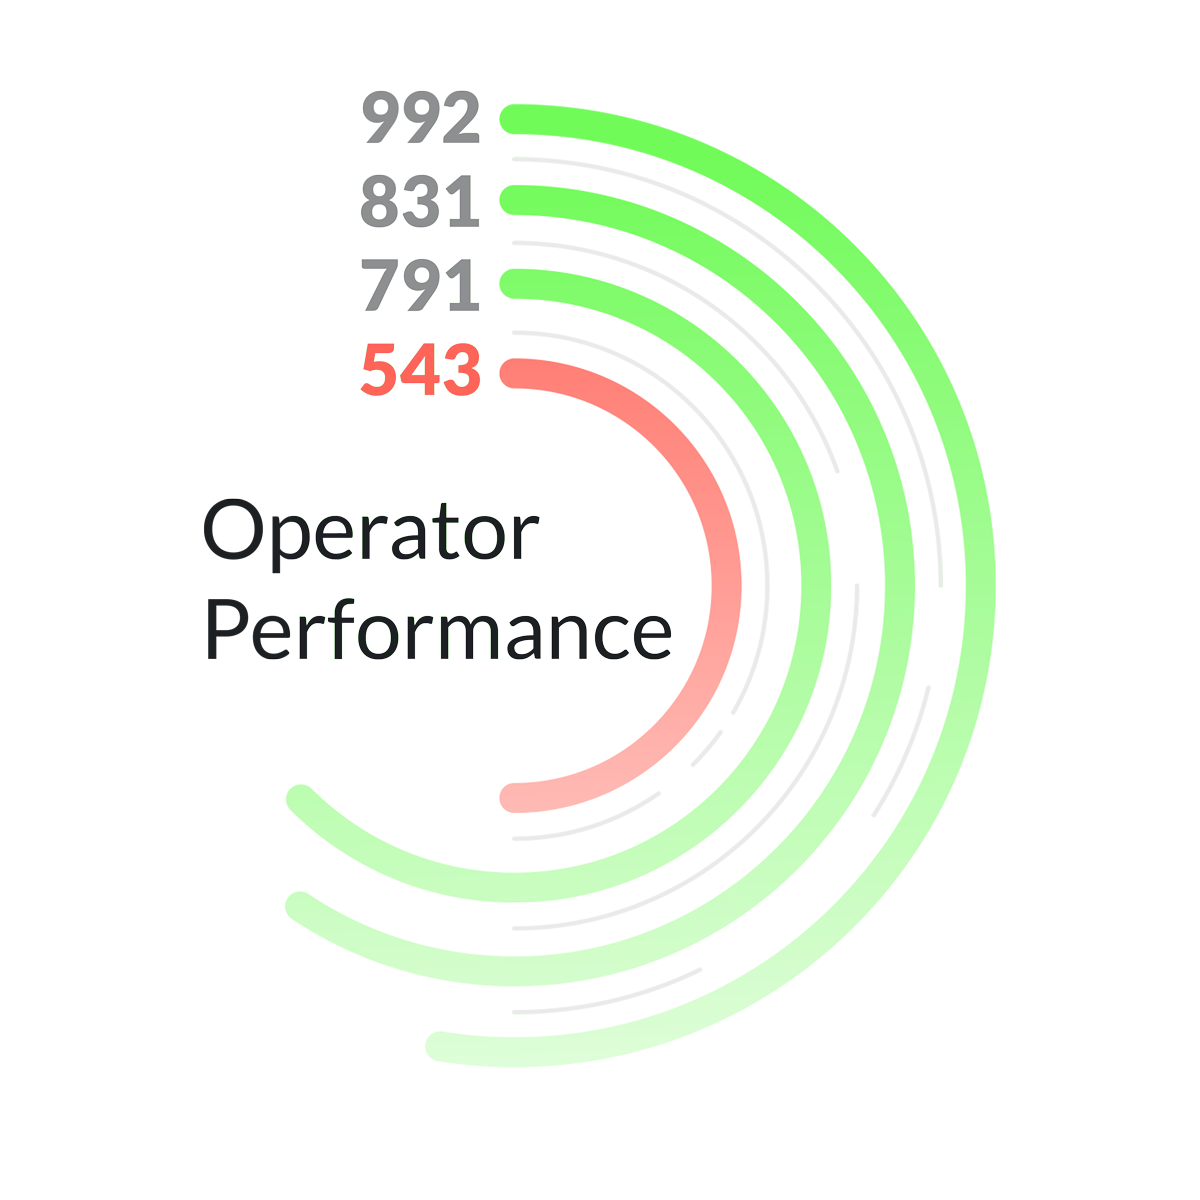
Reporting Tailored To Your Needs
Accurate and real-time reporting gives you the ability to detect anomalies and make decisions quickly. Choose from an array of pre-built reports, or configure your own to customize your Zeros dashboard to your needs.